100+ Social Media Marketing Statistics for Business | SlickText
Update March 12, 2025
In the world of marketing, no single strategy is the silver bullet to success. If you want to grow your audience and ensure your messages reach them, you’ll need to use more than one medium.
In addition to mass texting, social media marketing is one of the best ways to meet your customers where they are and reach the widest audience of global social media users — but you have to know which platform suits your needs.
Here are over 100 social media marketing stats for your business to help you decide where to focus your efforts, plus tips on how to incorporate text marketing into your strategy.
General Social Media Marketing Statistics
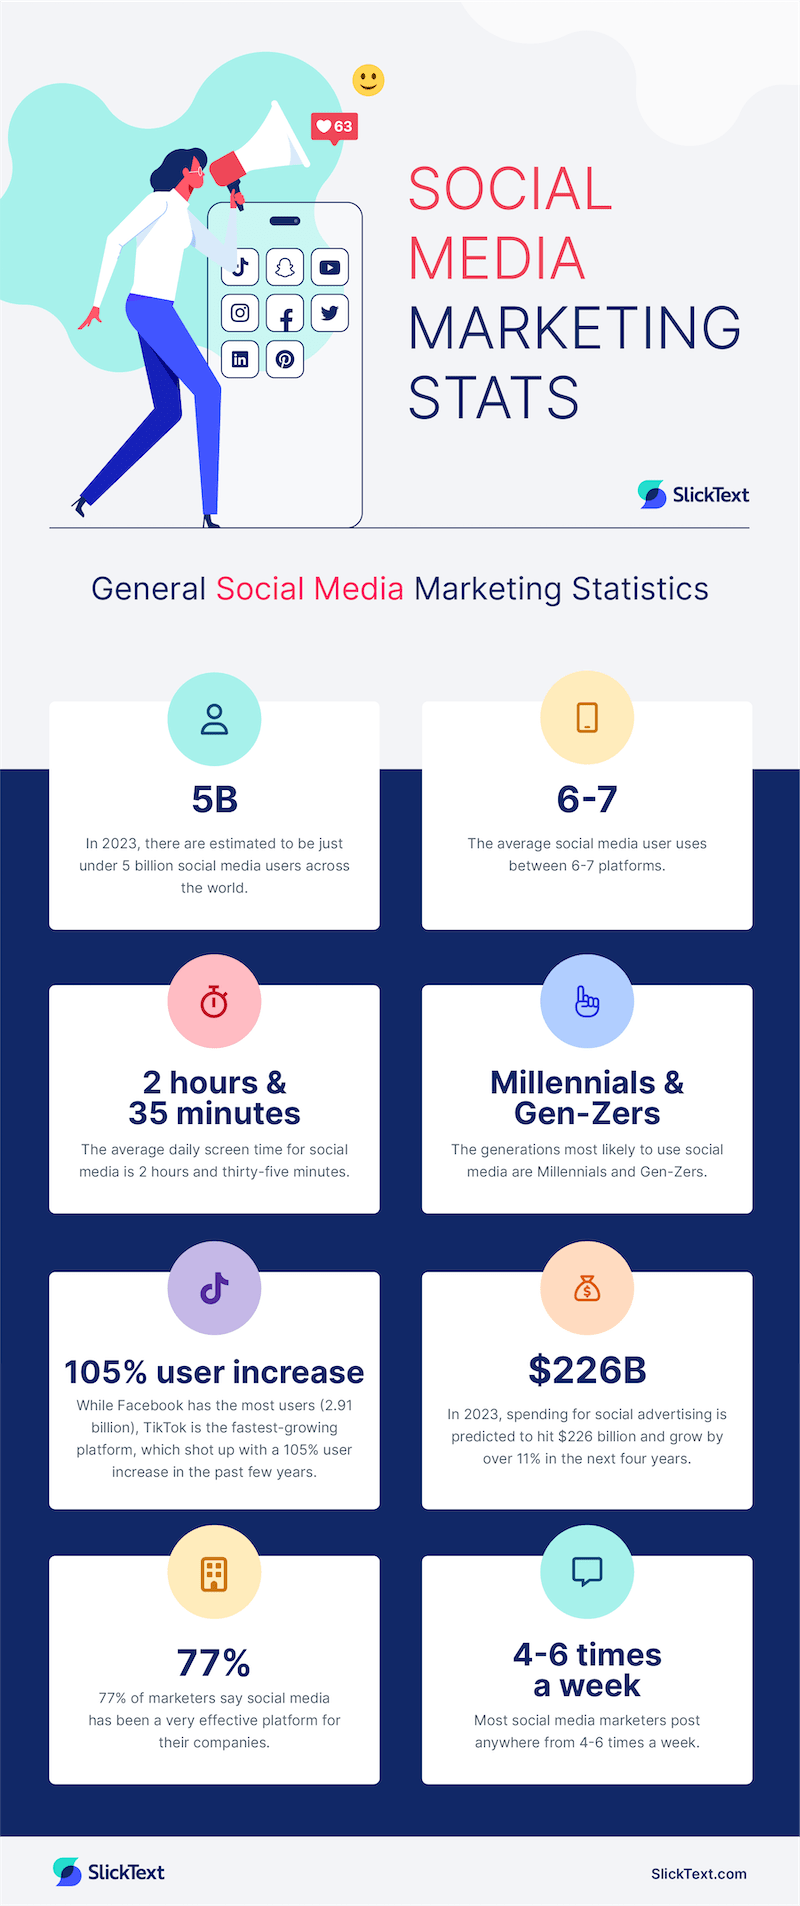
- In 2023, there are estimated to be just under 5 billion social media users across the world.
- The average social media user uses between 6-7 platforms.
- The average daily screen time for social media is 2 hours and thirty-five minutes.
- The generations most likely to use social media are Millennials and Gen-Zers.
- While Facebook has the most users (2.91 billion), TikTok is the fastest-growing platform, which shot up with a 105% user increase in the past few years.
- China has the most social media users (1,021,096 million), followed by India (755,47 million, then the United States (302,025 million).
- Gender is fairly evenly divided when it comes to social media. Globally, 54% of social media users are men and 46% are women. In the US, 76% of women and 74% of men have social media accounts.
- Social media marketing is a lucrative industry. In 2023, spending for social advertising is predicted to hit $226 billion and grow by over 11% in the next four years.
- Social media marketing works. According to 77% of marketers, social media has been a very effective platform for their companies.
- According to HubSpot, most social media marketers post anywhere from 4-6 times a week, and 82% reuse content across social media platforms.
- As far as the type of content goes, short-form video is the most popular amongst marketers no matter the platform.
Why Social Media Matters
With over 5.2 billion social media users worldwide, social media platforms are not just for personal connections. They’ve evolved into powerful tools for businesses, politics, and even dating.
- Global Reach: Social media platforms are used by billions of people globally, making them essential for businesses looking to reach a wide audience.
- Diverse Uses: From business marketing to daily communication, social media serves multiple purposes, making it a versatile tool in the digital landscape.
- Consumer Behavior: Social media significantly influences consumer behavior, with 60% of users discovering new products and services through these platforms.
- Online Networks: A staggering 71% of online adults use social media to connect with others, highlighting its role in modern communication.
- Marketing Tool: Social media is a cornerstone of digital marketing strategies, with 89% of global marketers leveraging these platforms to promote their brands.
Understanding the importance of social media can help you craft more effective marketing strategies and connect with your audience on a deeper level.
The Most Popular Social Media Platforms by Generation
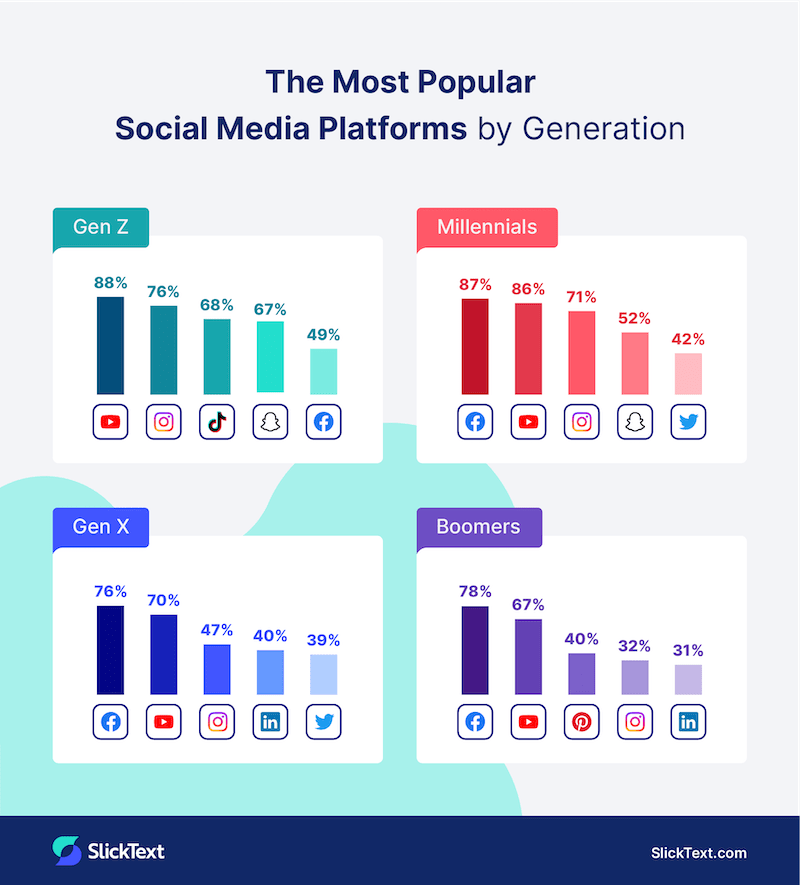
- Gen Z
- Youtube: 88%
- Instagram: 76%
- TikTok: 68%
- Snapchat: 67%
- Facebook: 49%
- Millennials:
- Facebook: 87%
- Youtube: 86%
- Instagram: 71%
- Snapchat: 52%
- Twitter: 42%
- Gen X
- Facebook: 76%
- Youtube: 70%
- Instagram: 47%
- LinkedIn: 40%
- Twitter: 39%
- Boomers
- Facebook: 78%
- Youtube: 67%
- Pinterest: 40%
- Instagram: 32%
- LinkedIn: 31%
Facebook Marketing for Business Statistics and Monthly Active Users
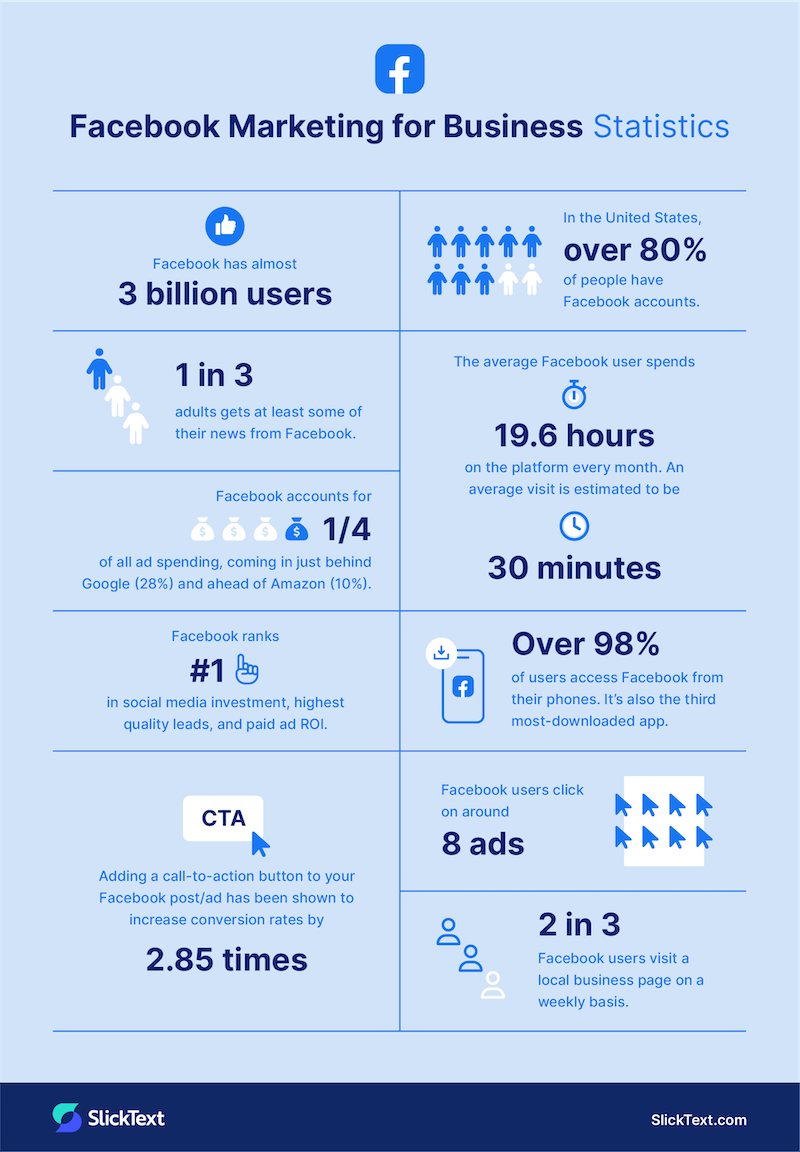
- Facebook has 3.05 billion monthly users.
- In 2025, Facebook’s daily user count is 5.1% higher than the previous year, with 2.09 billion daily users.
- In the United States, over 80% of people have Facebook accounts.
- 1 in 3 adults gets at least some of their news from Facebook.
- When it comes to digital ad spending, Facebook reigns supreme. The platform accounts for a quarter of all ad spending, coming in just behind Google (28%) and ahead of Amazon (10%).
- The average Facebook user spends 19.6 hours on the platform every month. An average visit is estimated to be 30 minutes.
- Facebook is a mobile-first platform, with over 98% of users accessing the platform from their phones. It’s also the third most-downloaded app.
- According to a poll from HubSpot, Facebook ranks number-one in social media investment, highest quality leads, and paid ad ROI.
- Facebook is much less popular among teens compared to adults. The percentage of teens that used the platform fell from 71% in 2014-2015 to 32% in 2022.
- Don’t ignore Facebook stories–57% of brands feel they’re one of the most effective ways to promote their products.
- Video posts have been proven to increase engagement by 600%.
- If you plan on live streaming, Facebook is the best option. The platform’s live video engagement is 26%, which is higher than other social media platforms.
- If you’re looking for a benchmark, the average engagement on a Facebook post is just under 4% while organic reach is just over 5%.
- On a monthly basis, Facebook users click on around 8 ads.
- Adding a call-to-action button to your Facebook post/ad has been shown to increase conversion rates by 2.85 times.
- 2 in 3 Facebook users visit a local business page on a weekly basis.
TikTok Marketing for Business Statistics
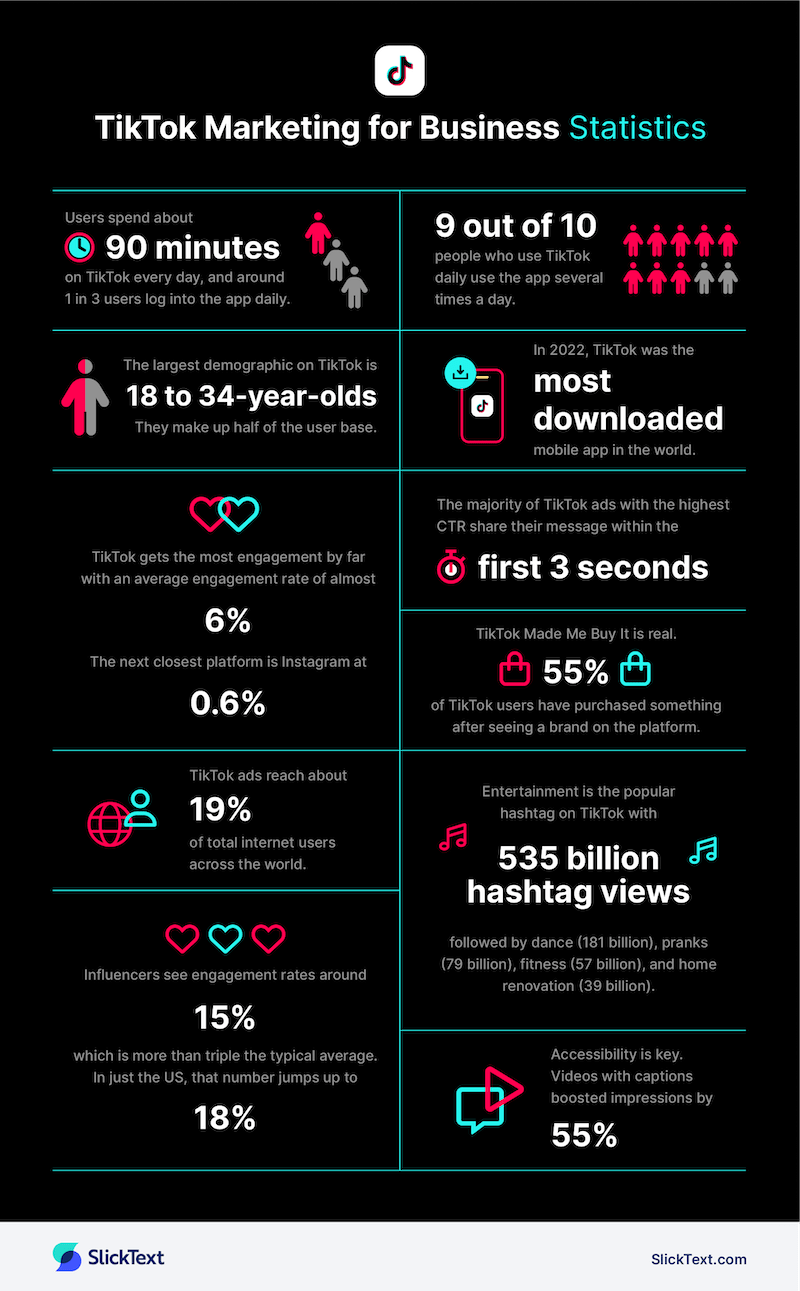
- Users spend about 95 minutes on the social media platform TikTok every day, and around 1 in 3 users log into the app daily.
- 9 out 10 people who use TikTok daily use the app several times a time.
- The largest demographic on TikTok is 18 to 34-year-olds. They make up half of the user base.
- In 2022, TikTok was the most downloaded mobile app in the world.
- Although TikTok is the newest social platform on the scene, it gets the most engagement by far with an average engagement rate of almost 6%. The next closest platform is Instagram at .6%.
- TikTok’s engagement potential is falling, however, dropping by 28% per year.
- TikTok has impressive visibility, with the platform’s ads reaching about 19% of total internet users across the world.
- Timing is key. The majority of TikTok ads with the highest CTR share their message within the first 3 seconds.
- If you work with an influencer, you may get even more out of your TikTok marketing. Influencers see engagement rates around 15%, which is more than triple the typical average. In just the US, that number jumps up to 18%.
- Despite high engagement, only 18% of marketers are actively using TikTok.
- TikTok Made Me Buy It is a real trend — 55% of TikTok users have purchased something after seeing a brand on the platform.
- TikTok lives have proven to be an effective marketing strategy. 50% of users have purchased something after watching a TikTok live. TikTok users are also 1.7 times more likely than other social media users to watch a live stream with the intention of buying a branded product.
- Entertainment is the popular hashtag on TikTok (535 billion hashtag views), followed by dance (181 billion), pranks (79 billion), fitness (57 billion), and home renovation (39 billion).
- Longer videos have been shown to receive higher views and engagement.
- TikTok is ranked in the top spot for driving consumer spending.
- Influencer marketing sells. Working with creators has been shown to boost views by as much as 193%.
- The optimal length for TikTok videos is 21-34 seconds — they have a 1.6% higher impression rate.
- Accessibility is key. Videos with captions boosted impressions by 55%.
LinkedIn Marketing for Business Statistics

- LinkedIn’s usage is smaller than other platforms, coming in at around 875 million global users.
- Around 1 in 3 people in the United States use LinkedIn. Most of those users make at least $75,000 a year.
- The most popular age range on LinkedIn is 25 to 34 years old, making up 60% of users.
- 92% of Fortune 500 companies are active on LinkedIn.
- While the audience is smaller, LinkedIn boasts high engagement. LinkedIn ads have a conversion rate that’s around 3 times higher than other platforms.
- The global reach of LinkedIn ads is over 800 million potential users.
- 97% of B2B marketers are using LinkedIn in their marketing strategy, and 82% of them rate LinkedIn as their most effective platform.
- Filling out your LinkedIn profile helps with visibility. Complete profiles get around 30% more views on a weekly basis.
- Because of the presence of more senior business leaders, LinkedIn users have almost double the buying power of other social media users.
- Including a link in your post can boost engagement by an average of 45%.
- Encourage your employees to share your LinkedIn posts, and you could get twice as much engagement.
- LinkedIn is ideal for finding and pursuing leads, proving to be 277% more effective than Facebook and Twitter. The average visitor-to-lead for LinkedIn is just under 3%, compared to .77% on Facebook and .69% on Twitter.
- The average visit on LinkedIn is just 8 minutes.
- If you’re posting on LinkedIn, length is best. The recommended word count is around 2,000.
- The magic number of images to include in a post is 8. Including 8 images leads to the highest engagement.
- For maximum engagement, LinkedIn recommends posting at least once per week and including relevant hashtags in your post. Most marketers actually post much more than that, though, at 4 to 6 times a week.
- Almost 50% of social media traffic to a company’s website is funneled from LinkedIn.
Instagram Marketing for Business Statistics
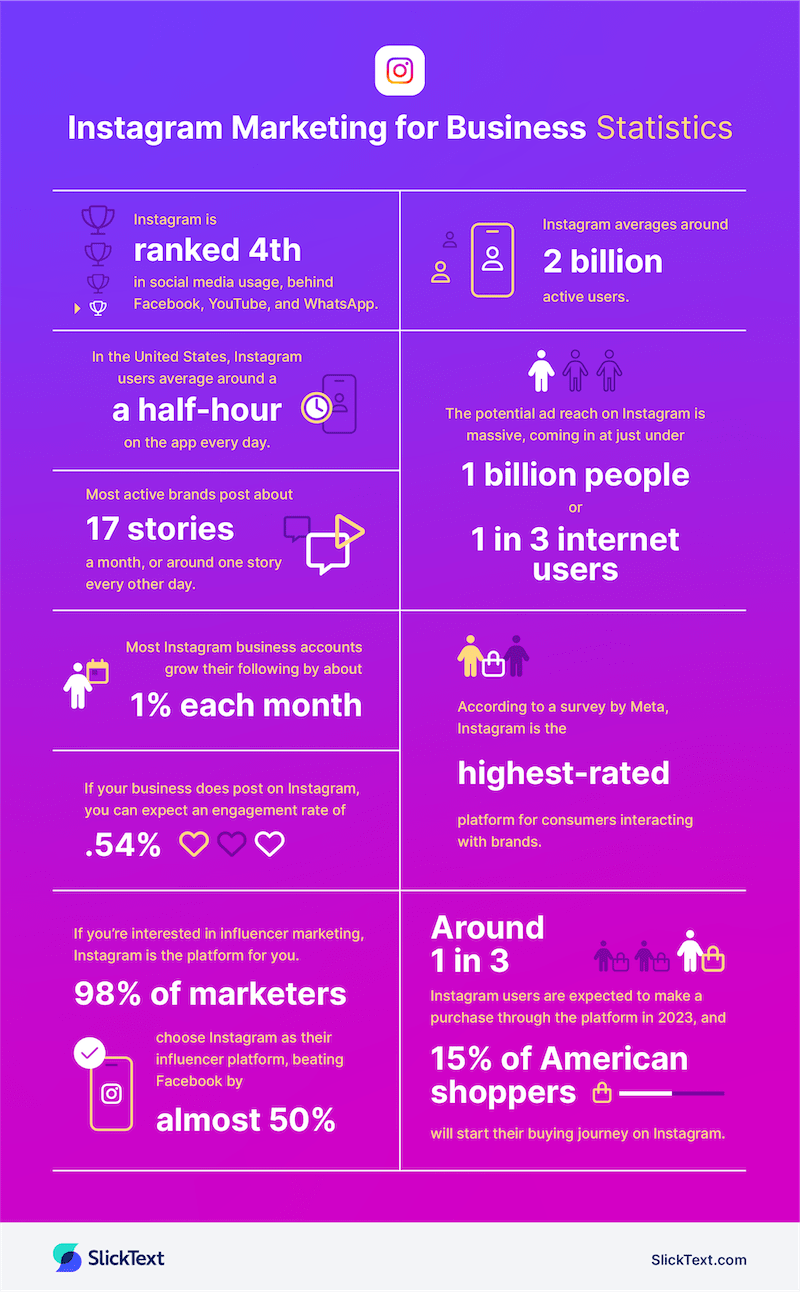
- Instagram is ranked fourth in social media usage, behind Facebook, YouTube, and WhatsApp.
- The app averages around 2 billion active users.
- While TikTok is rising in rankings, Instagram is still the app of choice for Gen Z.
- In the United States, Instagram users average around a half-hour on the app every day.
- The potential ad reach on Instagram is massive, coming in at just under 1 billion people, or 1 in 3 internet users.
- Most active brands post about 17 stories a month, or around one story every other day.
- According to a survey by Meta, Instagram is the highest-rated platform for consumers interacting with brands.
- Most Instagram business accounts grow their following by about 1% each month.
- If your business does post on Instagram, you can expect an engagement rate of .54%.
- Around 1 in 3 Instagram users are expected to make a purchase through the platform in 2023, and 15% of American shoppers will start their buying journey on Instagram.
- 98% of marketers choose Instagram as their influencer platform, beating Facebook by almost 50%.
- Instagram Reels play a major role in engagement, as 91% of Instagram users report watching videos on the platform every week. Reels are also one of the most shared types of content in Instagram DMs.
- Video marketing is a critical element for businesses to engage their target audiences and convert leads on Instagram.
- 7 in 10 Instagram users don’t mind seeing ads when watching videos on the platform.
Twitter Marketing for Business Statistics
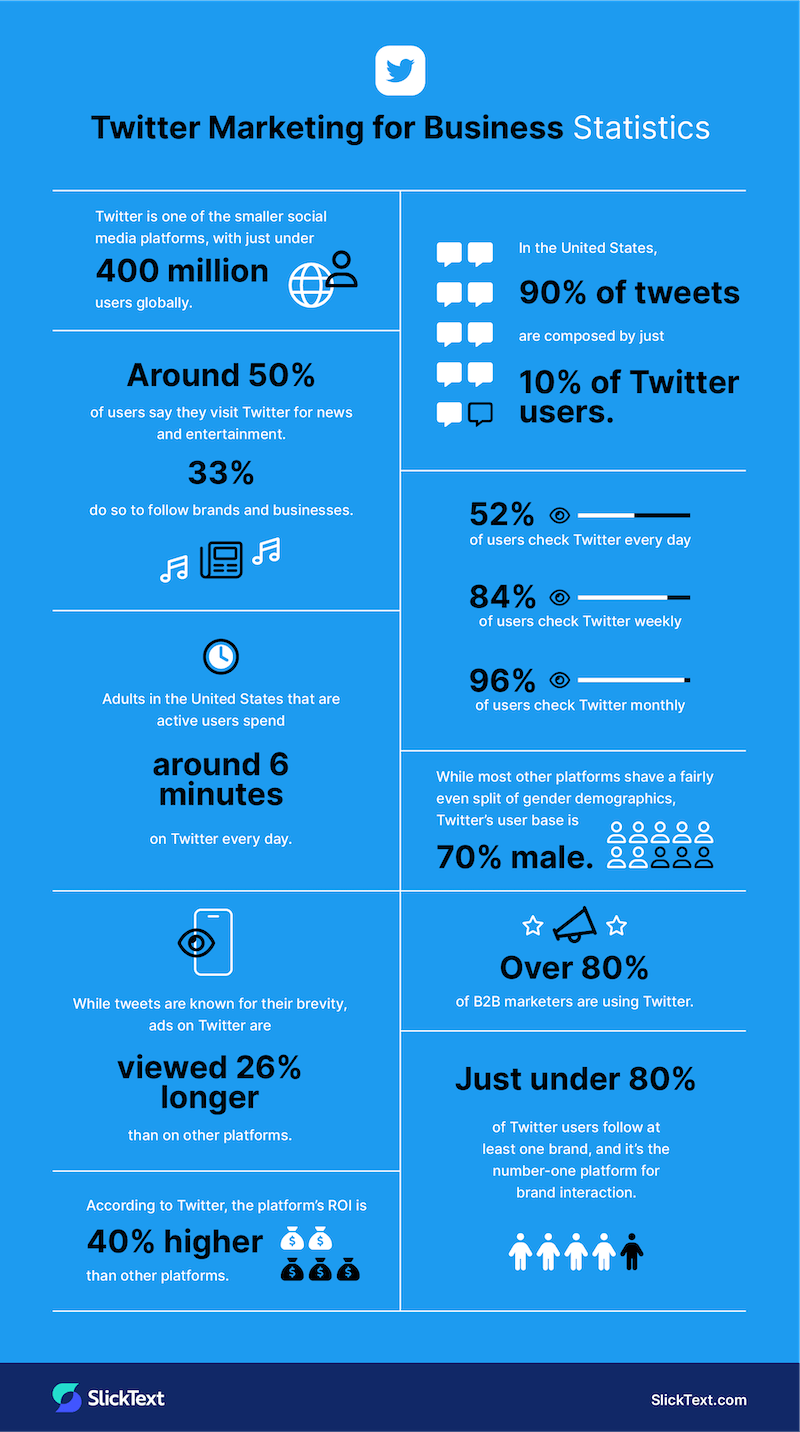
- Twitter is one of the smaller social media platforms, with just under 400 million users globally.
- In the United States, 10% of Twitter users compose 90% of the platform’s tweets.
- Around 50% of users say they visit Twitter for news and entertainment. 33% do so to follow brands and businesses.
- 52% of users check Twitter every day, 84% check weekly, and 96% check monthly.
- Adults in the United States that are active users spend around 6 minutes on Twitter every day.
- While most other platforms shave a fairly even split of gender demographics, Twitter’s user base is 70% male.
- While tweets are known for their brevity, ads on Twitter are viewed 26% longer than on other platforms.
- Over 80% of B2B marketers are using Twitter.
- Just under 80% of Twitter users follow at least one brand, and it’s the number-one platform for brand interaction.
- According to Twitter, the platform’s ROI is 40% higher than other platforms.
- Twitter also found that brands who use the platform are over 2 times more likely to meet their KPIs.
- Twitter is one of the most liberal-leaning social media platforms, with 65% of users identifying as Democrats.
- Users under 30 visit Twitter too frequently to keep track, so targeting campaigns for this audience typically produces better results.
- Twitter users value brands that show support for social issues, with 77% of people reporting more positive feelings when they see brands support local and global causes.
User-Generated Content (UGC) Statistics
User-generated content (UGC) is becoming more and more powerful for brands, offering authenticity and trust that traditional advertising often lacks. Here are some compelling statistics that highlight the value of UGC in social media marketing:
- Trust and Credibility: 85% of consumers trust recommendations from friends and family, making UGC a highly credible source of information.
- Increased Sales: Brands that incorporate UGC into their marketing strategies can see up to a 20% increase in sales and conversions.
- Engagement Rates: Utilizing UGC can boost engagement rates by 25%, as consumers are more likely to interact with content created by their peers.
- Platform Popularity: Instagram is a leading platform for UGC, with 71% of online adults using it to discover new products and services.
- Brand Trust: 70% of consumers are more likely to purchase from a brand that features UGC, underscoring its impact on brand trust and loyalty.
Incorporating UGC into your social media marketing strategy can enhance brand authenticity, drive engagement, and boost sales.
Social Media Marketing and Business Text Messaging
When you pair broadcast texting with social media marketing, you can easily maximize your business’ reach. As average screen times continue to increase, text marketing is one of the most effective ways to be seen.
Here are a few key text marketing statistics to keep in mind:
- Text messages have a 98% open rate within the first 3 minutes of sending
- People look at their phones around every ten minutes, which amounts to almost 100 times per day
- SMS has conversion rates as high as 45%
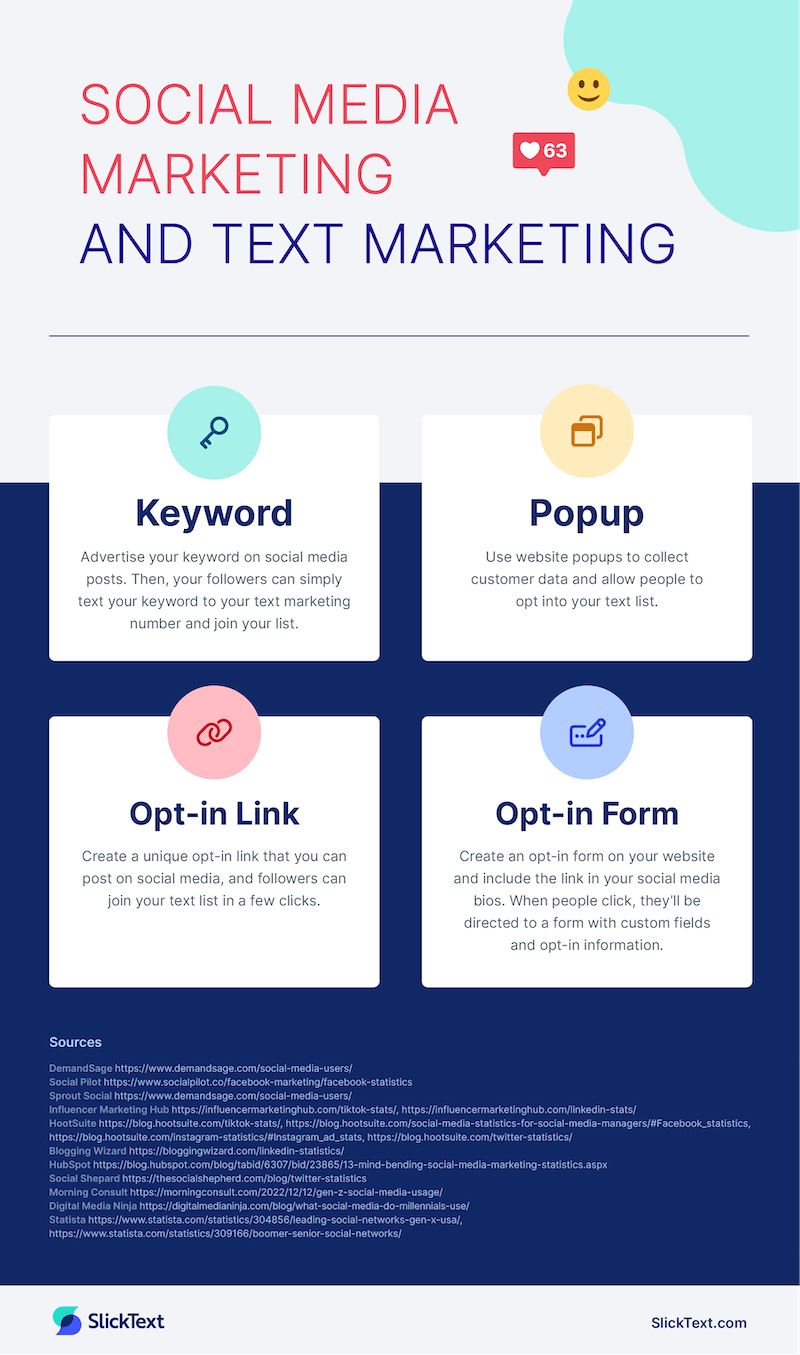
Maybe you’re thinking, “That all sounds great, but how do I advertise my text marketing list to my social media followers?” Luckily, integrating these two strategies can be done in a few simple ways. Here’s what we recommend:
- Advertise your keyword on social media posts. Then, your followers can simply text your keyword to your text marketing number and join your list.
- Use website popups to collect customer data and allow people to opt into your text list.
- Create a unique opt-in link that you can post on social media, and followers can join your text list in a few clicks. Consider offering a text promotion to encourage more sign-ups.
- Create an opt-in form on your website and include the link in your social media bios. When people click, they’ll be directed to a form with custom fields and opt-in information.
Start Text Marketing with SlickText
Ready to add texting to your marketing mix? Get started for free with a 14-day trial, and get in touch with our team if you have any questions.
Sources:
- DemandSage
- SocialPilot
- Sprout Social
- Influencer Marketing Hub, Influencer Marketing Hub 2
- HootSuite, HootSuite 2, HootSuite 3, HootSuite 4
- Blogging Wizard
- HubSpot
- Morning Consult
- Digital Media Ninja
- Statista, Statista 2