30+ Average Screen Time Statistics for 2026
Updated May 5, 2026
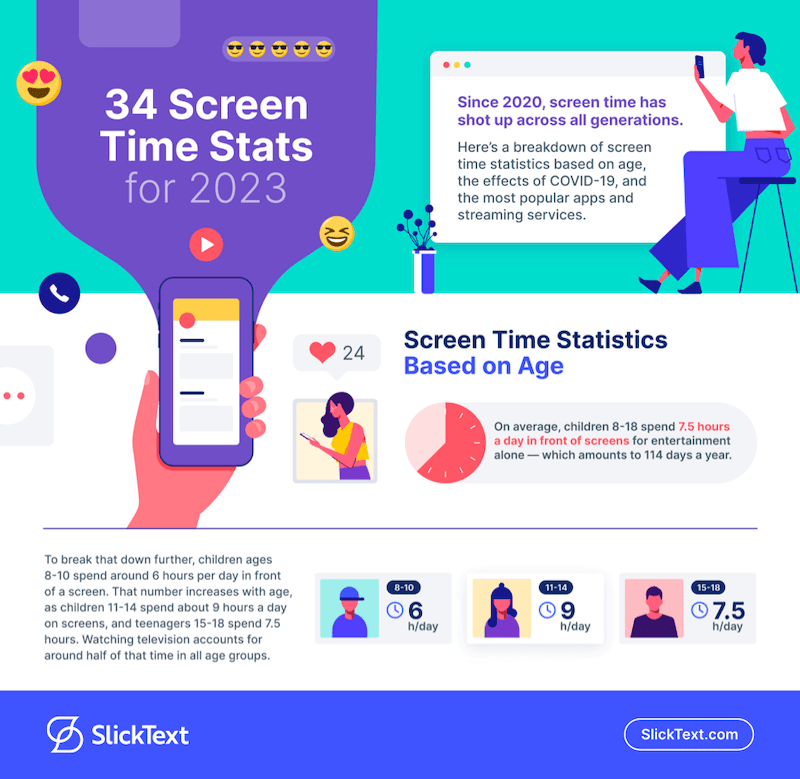
Screen time is still a major part of daily life, from phones and laptops to streaming, gaming, social media, and work. For marketers, this reinforces why a thoughtful SMS marketing strategy matters: phones are where people already spend a major part of their day. Below are the latest average screen time statistics by age, generation, device, and activity, plus signs that your screen habits may be affecting your sleep, focus, or well-being.
Average Screen Time Statistics: Key Findings
- Children ages 8–18 spend about 7.5 hours per day using screens for entertainment.
- U.S. adults commonly spend about 4 to 5 hours per day on their phones.
- Global online adults spend about 18 hours and 36 minutes per week on social and video feeds.
- TikTok users spend about 1 hour and 37 minutes per day on the app.
- Too much screen time can contribute to sleep problems, lower physical activity, mood issues, and reduced time with family and friends.
Average Screen Time By Age
How much screen time is recommended for kids?
Screens are more ubiquitous than ever, and average screen time by age reflects that. While many people look for a single “right” number, screen time recommendations actually vary by age and situation.
For younger children, experts recommend limiting screen use and staying actively involved:
- Under 18 months: Video chatting is typically the only recommended screen use.
- 18–24 months: Limited to high-quality programming with a caregiver.
- Ages 2–5: About 1 hour of non-educational screen time on weekdays and up to 3 hours on weekends.
For kids ages 6 and older, the focus shifts away from strict limits and toward building healthy habits. This includes prioritizing sleep, physical activity, schoolwork, and screen-free family time.
In reality, average screen time for children and teens is often much higher than these recommendations.
Average Screen Time for Young Adults
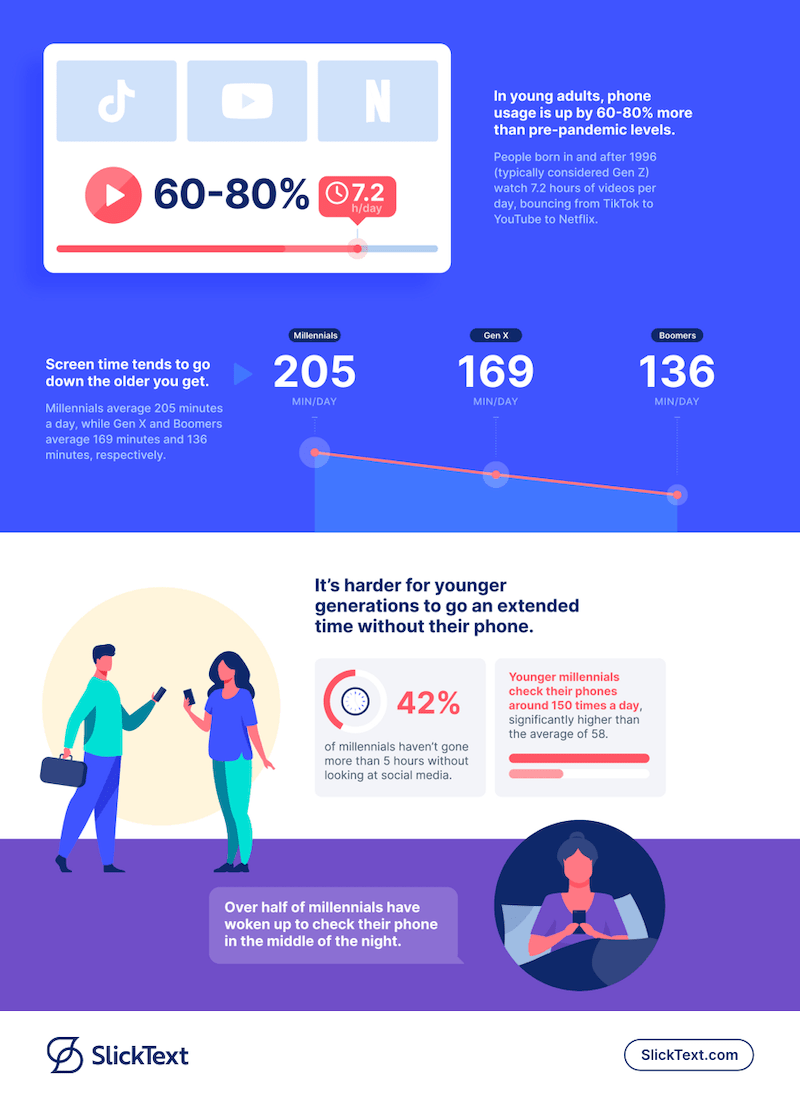
- In young adults, phone usage is up by 60-80% compared to pre-pandemic levels. People born in and after 1996 (typically considered Gen Z) watch 7.2 hours of videos per day, bouncing from TikTok to YouTube to Netflix.
- Average screen time tends to go down the older you get. Millennials average 205 minutes a day, while Gen X and Boomers average 169 minutes and 136 minutes, respectively.
- It’s harder for younger generations to go an extended time without their phone. 42% of millennials haven’t gone more than 5 hours without looking at social media, and younger millennials check their phones around 150 times a day, significantly higher than the average of 58.
- That constant access is one reason businesses use a mass texting service to reach customers quickly with timely updates, reminders, and offers. Over half of millennials have woken up to check their phone in the middle of the night.
 Average Screen Time for Boomers, Gen X, Millennials, and Gen Z
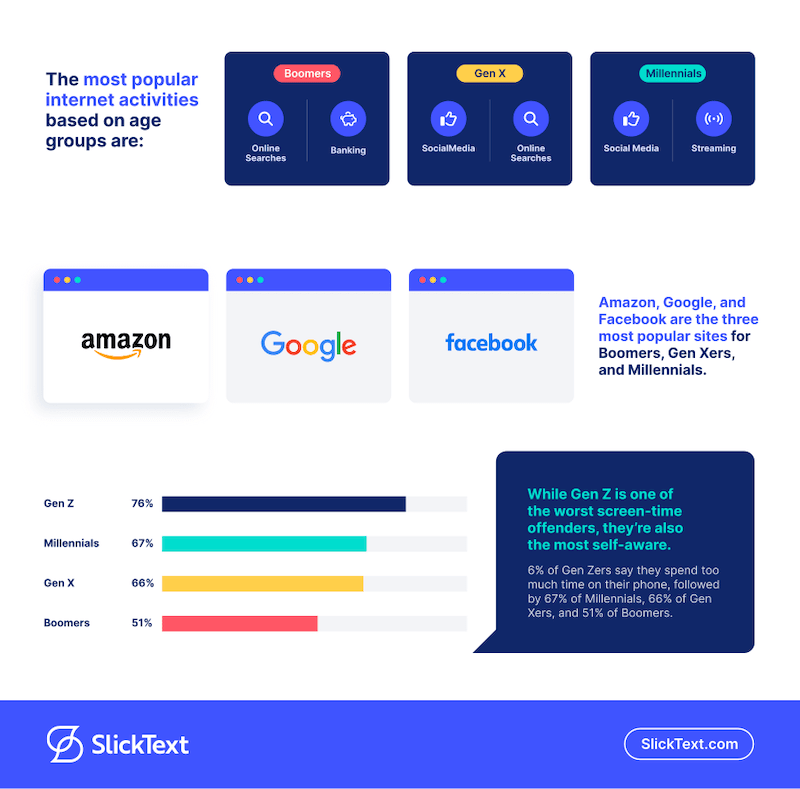
The most popular internet activities based on age groups are:
- Boomers: online searches and banking
- Gen X: social media and online searches
- Millennials: social media and streaming
- Amazon, Google, and Facebook are the three most popular sites for Boomers, Gen Xers, and Millennials.
- While Gen Z is one of the worst screen-time offenders, they’re also the most self-aware. 76% of Gen Zers say they spend too much time on their phone, followed by 67% of Millennials, 66% of Gen Xers, and 51% of Boomers.
COVID and Phone Screen Time Statistics
With the shift to working and schooling from home, adults and children had no choice but to spend more time in front of screens. Not all of that screen time is considered negative, however, as some of it was used for things like virtual social gatherings and spending time with family.
Still, a few years after the onset of the pandemic, that heightened average screen time is lingering longer than many people may have anticipated.
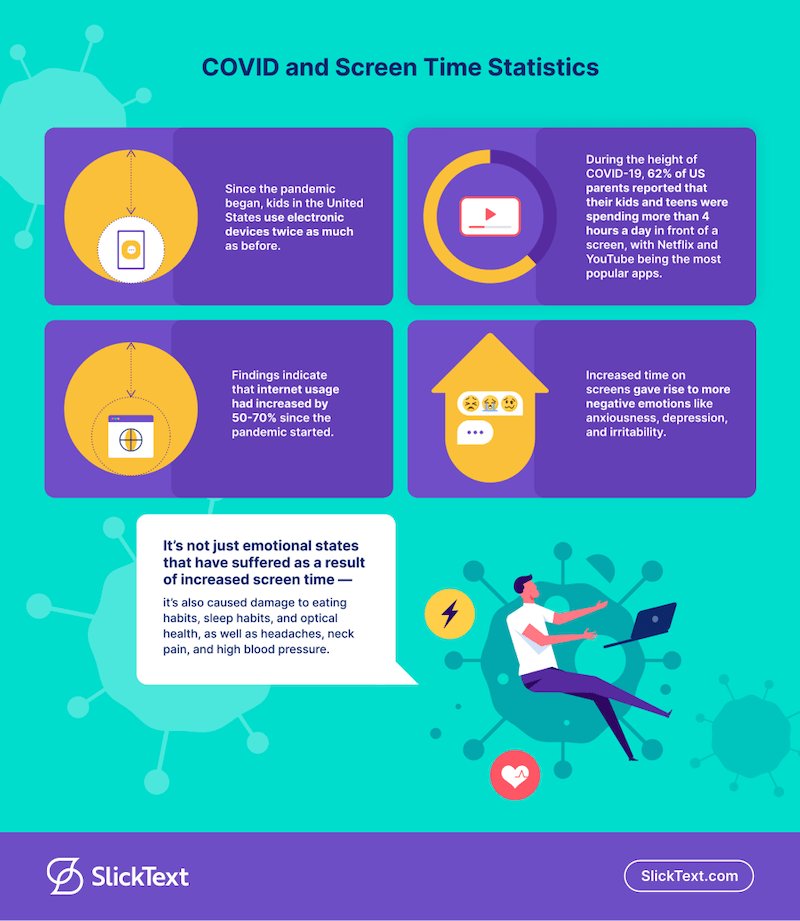
- Since the pandemic, kids in the United States use electronic devices twice as much as before.
- During the height of COVID-19, 62% of U.S. parents reported that their kids and teens were spending more than 4 hours a day in front of a screen, with Netflix and YouTube being the most popular apps.
- When it comes to staying connected during COVID, teens far preferred texting to calling. 83% of teens used texting to stay in touch, 72% used phone calls, and 37% used email.
- Findings indicate that internet usage increased by 50-70% since the pandemic started.
- Increased time on screens gave rise to more negative emotions like anxiousness, depression, and irritability.
- It’s not just emotional states that have suffered as a result of increased screen time — it’s also caused damage to eating habits, sleep habits, and optical health, as well as headaches, neck pain, and high blood pressure.
Average Screen Time Trends: The Most Popular Apps and Digital Activities

- Gen Z spends about half of their screen time on user-created content on TikTok and YouTube. This varies greatly from Gen X, who spend around ¾ of their time on professionally produced content.
- Streaming services are struggling to fight subscriber drain, but Deloitte found that one-fourth of people from the US who canceled a subscription returned to that service within 12 months. This was especially true for Gen Z.
- In the United States, the top three most popular social media activities were reading/watching the news, listening to music, and watching TV/movies. Again, Gen Z was an outlier, identifying video games as the most popular activity.
- Gen Z and Millennial gamers spend 11-13 hours on gameplay per week.
- Some of the most popular reasons for gaming include relaxation, self-expression, and distraction during difficult times.
- Gaming provides the opportunity to multitask. Around half of all video game players in the US also listen to new music while playing.
- In 2026, apps like TikTok, YouTube, Instagram, and Facebook continue to dominate mobile screen time, with users spending well over an hour per day on top platforms, particularly short-form video apps.
- Worldwide, the most popular mobile apps in 2026 are driven more by time spent than total downloads. Leading apps include:
- TikTok — one of the highest time-spent apps, with many users averaging over an hour per day
- YouTube — a top platform for video streaming and long-form content consumption
- Instagram — widely used for social media, messaging, and short-form video
- Facebook — still one of the largest platforms by total active users
- WhatsApp — a leading global messaging app with billions of users
- Snapchat — especially popular among younger audiences for messaging and media sharing
- Spotify — a leading app for music and audio streaming
- ChatGPT — one of the fastest-growing AI apps, increasingly used daily for search, writing, and productivity
- Amazon
- Walmart
- Target
- eBay
- Apple
- Best Buy
Average Time Spent on Social Media Apps Per Day
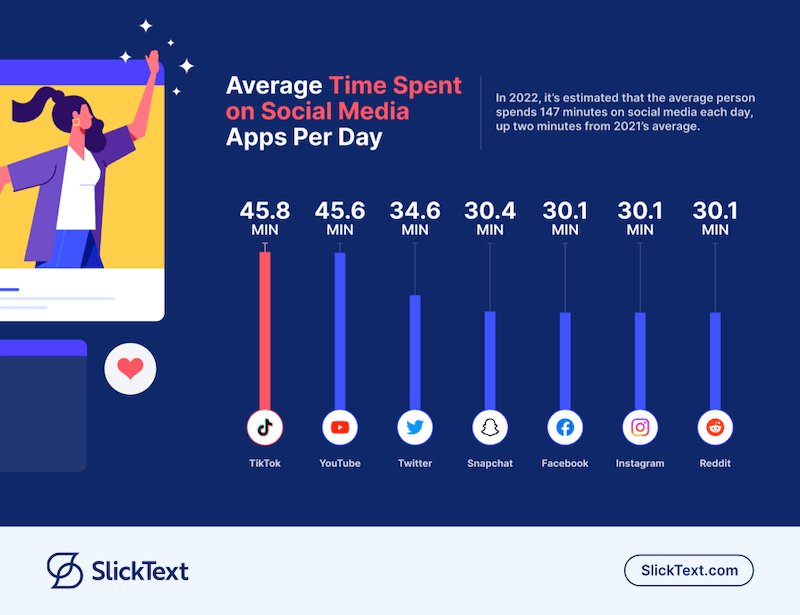
As of 2026, the average person spends about 2.5 hours per day on social media, with time spent continuing to grow across video-first and messaging platforms.
- TikTok: 1 hour 37 minutes
- YouTube: 1 hour 25 minutes
- Instagram: 1 hour 13 minutes
- Facebook: 1 hour 7 minutes
- WhatsApp: 59 minutes
- imo: 53 minutes
- Telegram: 30 minutes
- X (formerly Twitter): 28 minutes
- Reddit: 19 minutes
- Messenger: 19 minutes
- Snapchat: 17 minutes
- Discord: 15 minutes
- Pinterest: 10 minutes
- LinkedIn: 6 minutes
- Threads: 4 minutes
Average Time Spent on Streaming Services Per Day
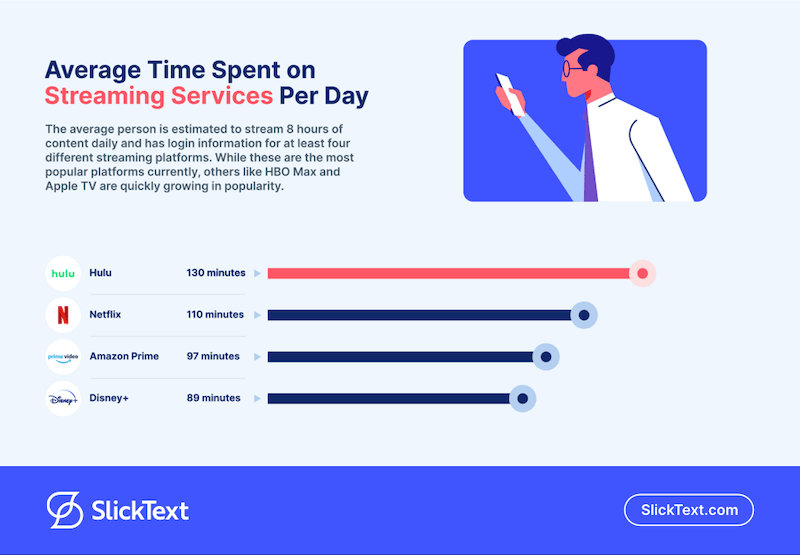
Streaming continues to dominate screen time, with audiences spending a record 16.7 trillion minutes streaming in 2025, a 19% increase year over year. Much of this growth is driven by a mix of long-running “comfort shows” and major original releases.
- Bluey was the most-streamed show of the year, with over 45 billion minutes watched on Disney+
- Grey’s Anatomy ranked as the second most-streamed title, with more than 40 billion minutes viewed
- Stranger Things was the top original streaming series, reaching 40 billion minutes on Netflix
- Happy Gilmore 2 was the most-watched streaming movie, with over 7 billion minutes viewed
- Long-running “library shows” continue to dominate streaming, thanks to large episode catalogs and binge viewing
Signs of Excessive Screen Time
While not all screen time is bad, too much time in front of screens can have negative impacts on your social, physical, and emotional well-being. Here are some signs that it might be time to put down your phone.
- Poor sleep: Blue light exposure from screens can suppress melatonin, which is the hormone that helps regulate your sleep. When you use your phone close to bedtime, your body produces less melatonin, making it harder to sleep. A lack of proper rest can result in other health issues such as mental fog, an inability to focus, memory issues, mood swings, and lower energy levels.
- Vision impairment: You might find yourself squinting or straining when you stare at a screen for too long. The continued exposure to light and focus on something so close to your face can cause headaches, ocular sensitivity, dryness, blurred vision, and more. There’s even a chance for long-term vision damage, known as myopia.
- Chronic pain: Angling your head and neck to stare at a phone, computer, or TV can encourage poor posture. As a result, you might deal with recurring pain in your neck, back, and shoulders.
- Weight gain: Activities associated with screen time are almost always sedentary. Spending too much time sitting or laying can lead to weight gain, which can also cause diabetes, heart issues, and increased blood pressure.
- Poor mental health: Watching TV, playing video games, or browsing social media might feel good in the short term, but in the long term, it’s shown to cause higher levels of anxiety and depression and lower levels of social awareness.
By limiting your screen time to the recommended two hours per day, you can avoid some of the negative consequences associated with excessive use.
With people spending more time on their phones than ever, SMS marketing gives businesses a direct way to reach customers where they’re already active. Platforms like SlickText help brands send timely text messages, promotions, and updates to engaged subscribers.
Screen Time FAQs
What is the average screen time per day?
The average screen time varies by age and device, but many adults spend about 4 to 5 hours per day on their smartphones, with additional time on computers, TVs, and tablets. Total daily screen time is often much higher when all devices are combined.
What is the average screen time for kids and teens?
Children and teens tend to have higher screen time than adults, especially for entertainment. Many studies show that kids ages 8–18 spend around 7 or more hours per day on screens outside of schoolwork, including time spent on social media, gaming, and streaming.
How much screen time is too much?
There’s no single number that defines “too much” screen time. Instead, it depends on how screen use affects sleep, physical activity, school or work performance, and relationships. Screen time becomes excessive when it replaces healthy habits or interferes with daily responsibilities.
What are the signs of too much screen time?
Common signs of excessive screen time include trouble sleeping, difficulty focusing, eye strain, reduced physical activity, irritability, and spending less time with family or friends. Feeling anxious without your device or constantly checking your phone can also be warning signs. For more data on compulsive phone habits, see our smartphone addiction statistics.
Does screen time affect sleep?
Yes, screen time—especially before bed—can make it harder to fall asleep. Blue light from screens can disrupt your body’s natural sleep cycle, and late-night scrolling or streaming can delay bedtime and reduce overall sleep quality.
How can you reduce screen time?
You can reduce screen time by setting app limits, turning off nonessential notifications, creating screen-free times like during meals or before bed, and replacing screen use with other activities like exercise, reading, or spending time with others. Keeping devices out of the bedroom can also help improve sleep habits.
Sources:
Common Sense Media
AACAP
PC Mag
Elite Content Marketer
Frontiers
Los Angeles Times
Deloitte
Business of Apps
Shopify
Deadline
Indie Wire
DataReportal
Nielson